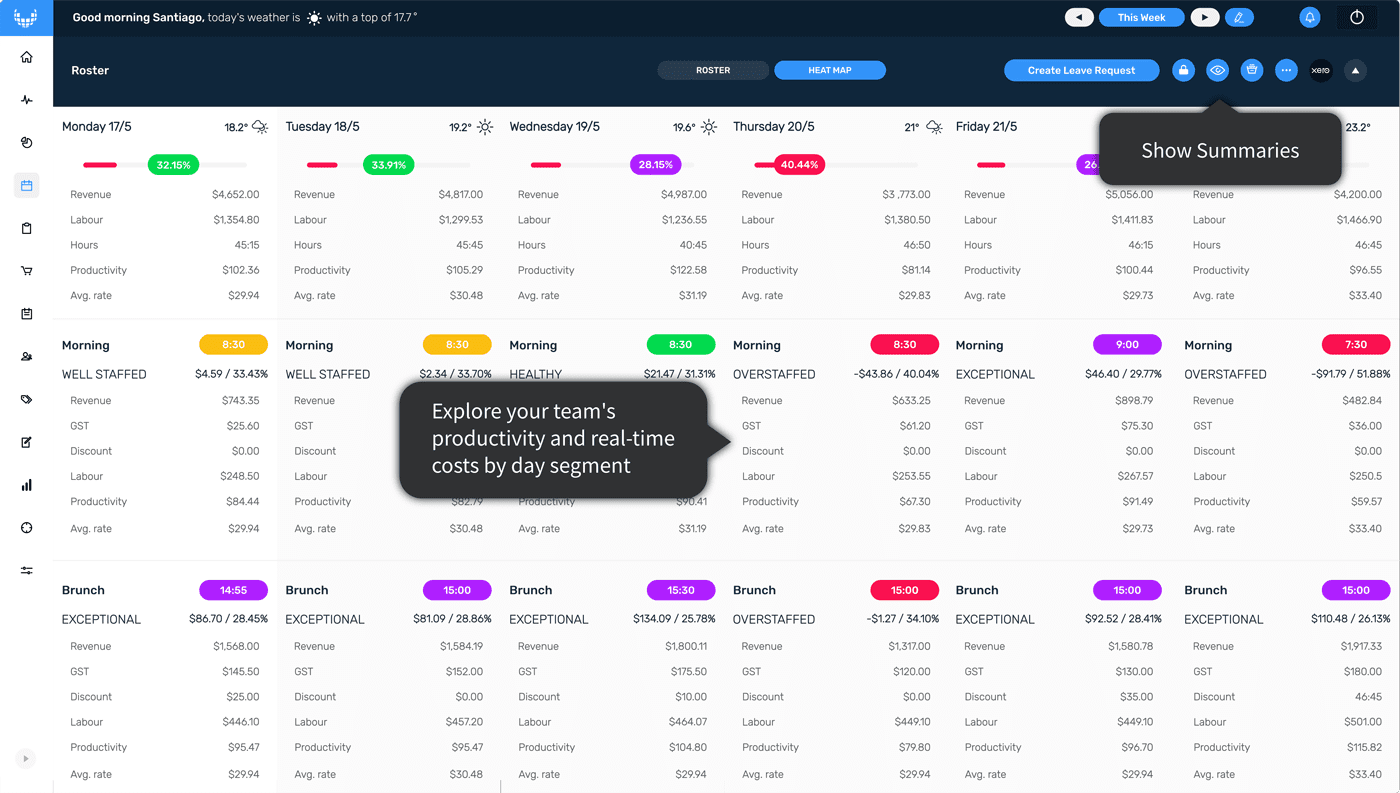
Great
rosters with Viability

Stable finances, smooth operations and happy people

Looking for better accountability & higher productivity ?

You already know that getting your staffing right—aka writing great rosters —is one of the best things you can do for your business. But what does a “great roster” actually mean?

Our method for the best rostering: strike a balance between the financial, operational and human parts of rostering to make a roster that’s great for you, your business and your team too.

  • Stable finances
    • A great roster hits your benchmark for labour costs every week. But more than that, it hits your benchmark every day and every service. It spreads the cost of labour in a smart way according to forecasts and projected revenue, throughout the day and the week.
  • Smooth operations
    • A great roster ensures you’ve always got people where you need them so your site will operate smoothly and your customers are consistently getting great products and great service.
  • Happy people
    • A great roster keeps your team satisfied. They feel supported during service and they can understand the staffing choices you’ve made. Happy teams stay motivated, so keeping your team happy with a good roster and easy access to shift information will help keep morale and productivity high.

Rostering Tools

Three tools to save time, increase productivity, cut costs and grow profit with rostering.

Rostering overview

The familiar way to look at rostering, this table layout is a good place to start.

Add new shifts

  • From the drop down menu select all of the employees that you’d like to add to the roster this week.
  • You can add as many employees as you need at once, then easily add or remove other employees later.
  • Next, click on an empty cell in an employee’s line, to add a shift for that employee on that day. You can also give them someone else’s shift by clicking and dragging the cell to their line.

Edit shift details

  • As you continue to add staff, keep one eye on the top of the add /edit shift screen. You’ll see the hours you’ve already rostered as well as the hours allowance calculated by Viability.
  • If your rostered hours (shown on the left) are more than your allocated hours (shown on the right) for each service, then you’re outside your benchmark and might be overstaffed compared to your smart revenue forecasts and unique benchmarks.

Roster builder

Use the Roster Builder to create and improve your rosters with full visibility.

Creating a new roster with Roster Builder

Use the blue plus buttons to add staff. The pop-up screen for shift creation is the same throughout overview and Roster Builder.

Once you’ve created the shift you can see how the new team member has changed the hours available in the header. If the number on the left (actual hours) is red for a trading segment, you’ve got more hours on your roster than your benchmark suggest in that segment.

Sometimes it’s impossible to staff a service within your benchmark. Open or close shifts may need more staff than the revenue allows, meaning other parts of the day will need to fall under benchmark. However, with Roster Builder you can see exactly where you stand, and make informed decisions about how to staff against your benchmarks. Find your day projection at the bottom of the screen to see where you stand.

Key features

You can use Roster Builder to create rosters from scratch or use it to refine your roster once it’s created or copied.

Roster Builder is great for:

  • Drilling down into your roster for each day and identifying room for improvement within segments.
  • Working with Viability’s hours allowance to meet your benchmarks.
  • Seeing a ‘clean’ view of the daily roster.
  • Easily seeing true staff costs per hour including WorkCover and Superannuation.
  • Flicking between the overview, Roster Builder and Heat Map, using the tabs on the sides.

Real time changes

Viability rostering is responsive —it changes in real time as you work, so you can see how small changes affect the big picture.

Working with hour budgets

On Wednesday (above) the true rostered hours are lower than the suggested hours, meaning the roster is performing better than the benchmark. Here, we could consider adding more hours to the roster to keep the team strong.

By contrast, on Thursday (below) every segment falls over budget compared to the benchmark.

This example is a real site that’s rostered 46:30 hours when they only have 39:05 to stay within their benchmark.

​The first thing to look for is easy wins. Adding breaks, starting shifts slightly later or knocking staff off earlier are all good options. But cutting 7.5 staff hours seems like slicing a whole person out of the roster. And maybe that doesn’t feel possible. So where do you start?

​A simple way to work towards improvement is to look at another day and identify key differences. On Wednesday (above), the revenue forecast is higher, but there are fewer hours on the roster. If they can do it on Wednesday, why not on Thursday too?

​The Heat Map can help go even deeper and understand what’s really going on.

Key takeaway

The answer is usually hidden in your own data. Roster Builder pulls those numbers out to help you you identify opportunities to slim down your roster. By looking at days with similar revenue, we can see what’s really possible.

The hours budget is the easiest way to create smart, productive rosters, stay within your benchmark and maintain consistency without doing a single manual calculation.

Heat Map

Use the Heat Map to see your true productivity and identify areas of improvement.

Zoom-in tool

The Heat Map is most useful as a ‘zoom in’ comparison tool. We can use it to hone in on problems, which makes it the perfect tool for finding solutions. Find Heat Map at the top of the roster screen.

Compare and improve

Below, we see that Thursday’s roster is showing red feedback and is over the benchmark. To find a solution, we can look closely at other days in the selected week that are showing better feedback and use that to see what’s possible.

We can see from the other weekdays that this site usually builds rosters within its benchmark. Knowing this, we can work to improve Thursday’s roster.

Wednesday

  • An ‘exceptional’ roster, much lower than the benchmark.
  • Higher revenue forecast: $4987.00.
  • Lower labour percentage (28.15%).
  • Higher productivity value ($122.58).

Thursday

  • An ‘overstaffed’ roster, higher than the benchmark.
  • Lower revenue forecast: $3,773.00.
  • Higher labour percentage (40.44%).
  • Lower productivity value ($81.14).

See summaries for the whole day’s roster:

  • Daily gross revenue (forecast or actual).
  • Discount amount GST Total labour cost including WorkCover and Super Hours rostered.
  • The average cost per hour of your staff mix How many shifts you’ve set Your hourly productivity rate.

See summaries for each trading segment:

  • Labour cost.
  • Hours rostered.
  • The average cost per hour of your staff mix.
  • How many shifts you’ve set.
  • Your hourly productivity rate.
  • Percentage cost against total revenue for this segment.

Productivity Tools

Viability is packed with tools to help you understand and improve productivity.

The math behind productivity measure

Productivity indicates how much revenue you take per hour of labour with the number of staff who are working. If you take $1,000 revenue in one hour with 10 staff working that full hour, you will see a productivity measure of $100.

The higher the dollar value, the better your productivity — you’ve rostered fewer hours against your revenue. Low productivity equals a lower dollar value per hour — you’ve rostered more hours against your revenue.

The hourly rate of individual team members doesn’t change the calculation for productivity, because productivity relates to how long a team takes to do a given job, not how much the team costs.

Why do we need productivity measures and also benchmarks?

Productivity is useful for measuring performance on site, but it’s not the best measure for financial performance.

​Productivity is most useful when it stays removed from staff pay rates. On the weekend or public holidays, penalty rates increase labour costs to higher than the normal benchmark, but productivity still needs to be roughly the same as a weekday — your team still needs the same amount of hours to do the same work. We can’t cut hours to meet our cost benchmark when the wages are 1.5x on the weekend, and expect our reduced team to handle 1.5 the workload per person.

​By using benchmarks for labour cost alongside productivity, Viability reveals the truth of both operational and financial performance.

How does your site compare?

Ideal productivity changes from site to site depending on your business model. About $95/hr is a sound result for a 34% labour benchmark in a cafe or espresso bar.

​A large bar venue serving mostly beer and wine could hope to achieve higher productivity, around $150/hr, because the team can serve more people and take more revenue per labour hour; the product is more expensive and doesn’t take as much time to prepare and sell, meaning they spend less time per dollar of revenue.

Improving rosters

Fast advice for improving rosters with Viability. Many of these tips are common knowledge in the industry, but we can apply a Viability method, giving us the tools to make these changes more easily and accurately.

Start and finish times

Finish shifts a little earlier or start them a little later.

Strategic breaks

Add breaks in segments that are just a little over.

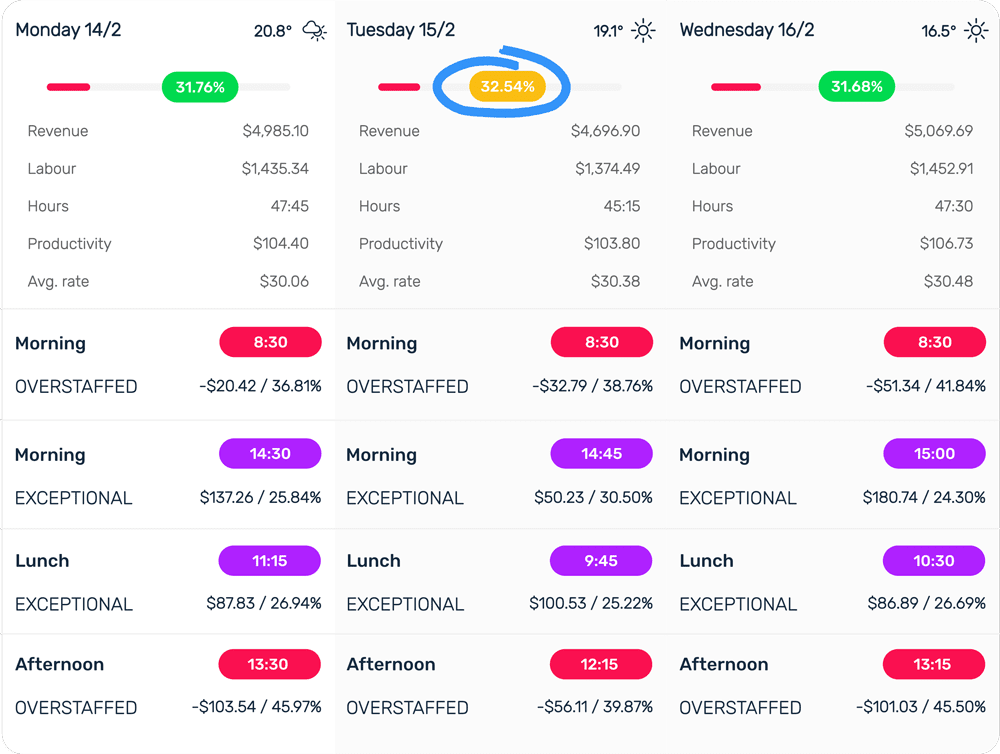
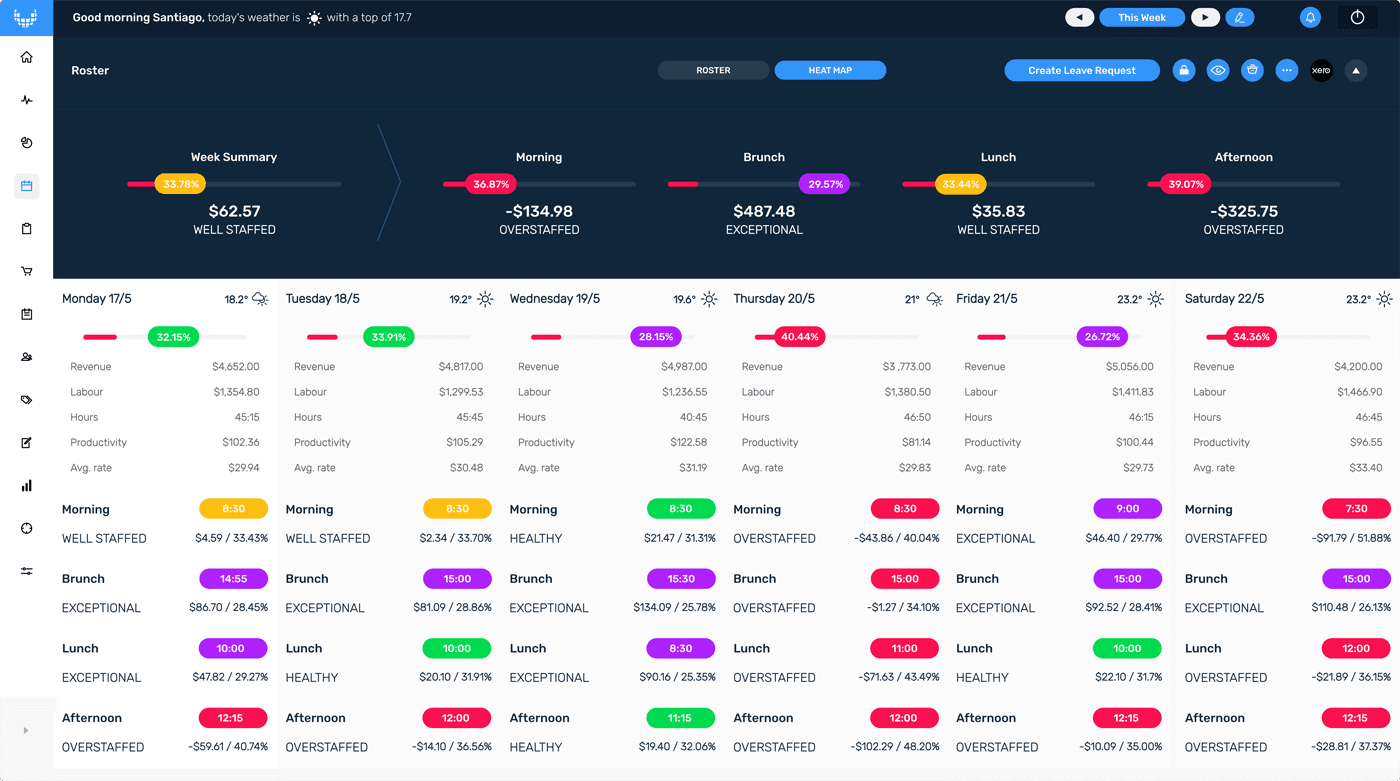
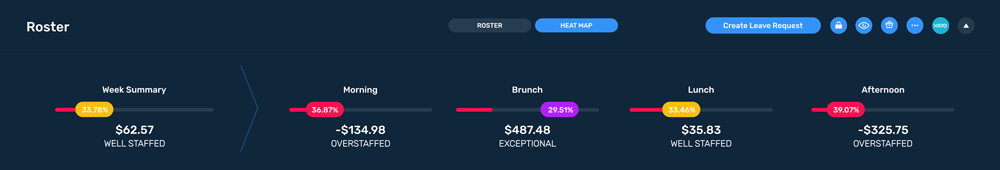
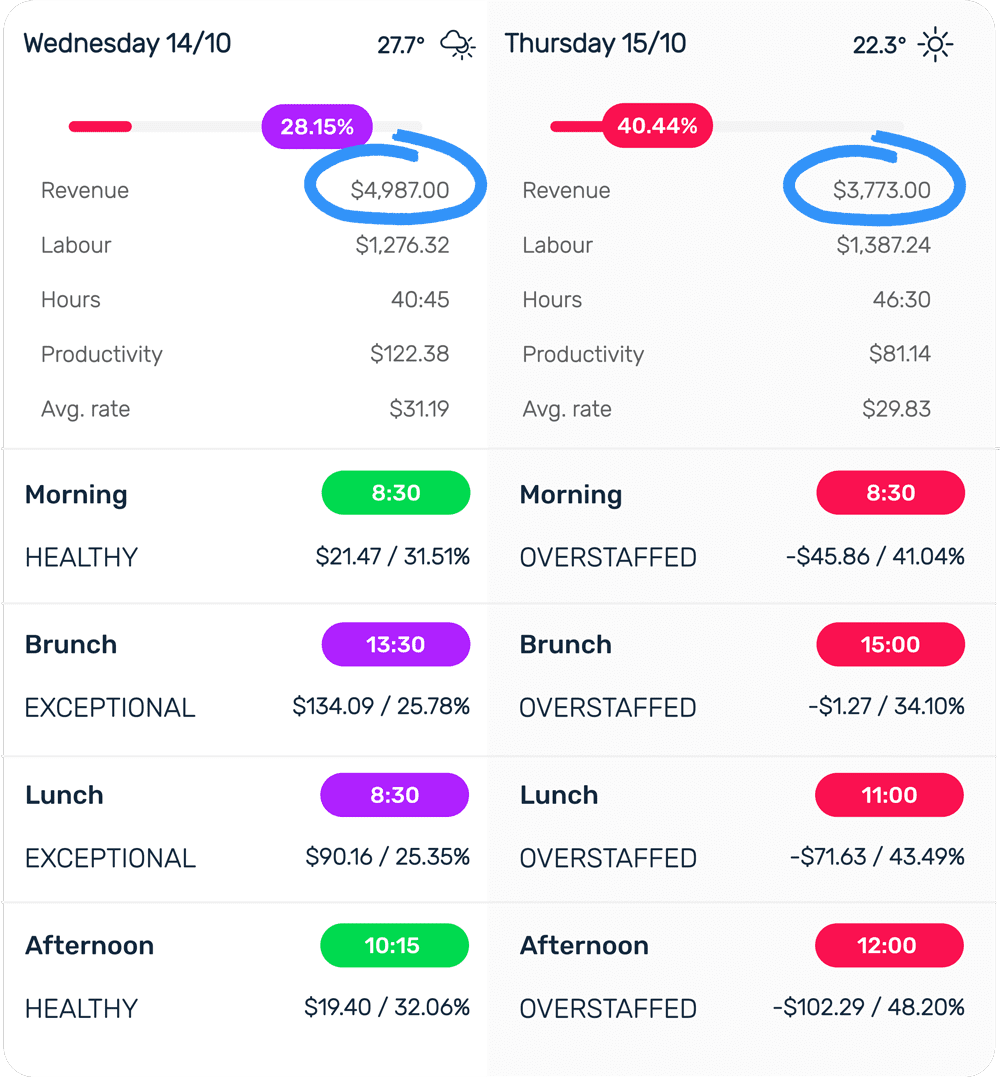
Same revenue, different roster

Look for entire days with similar revenue that have a healthier roster. What can you learn from them?

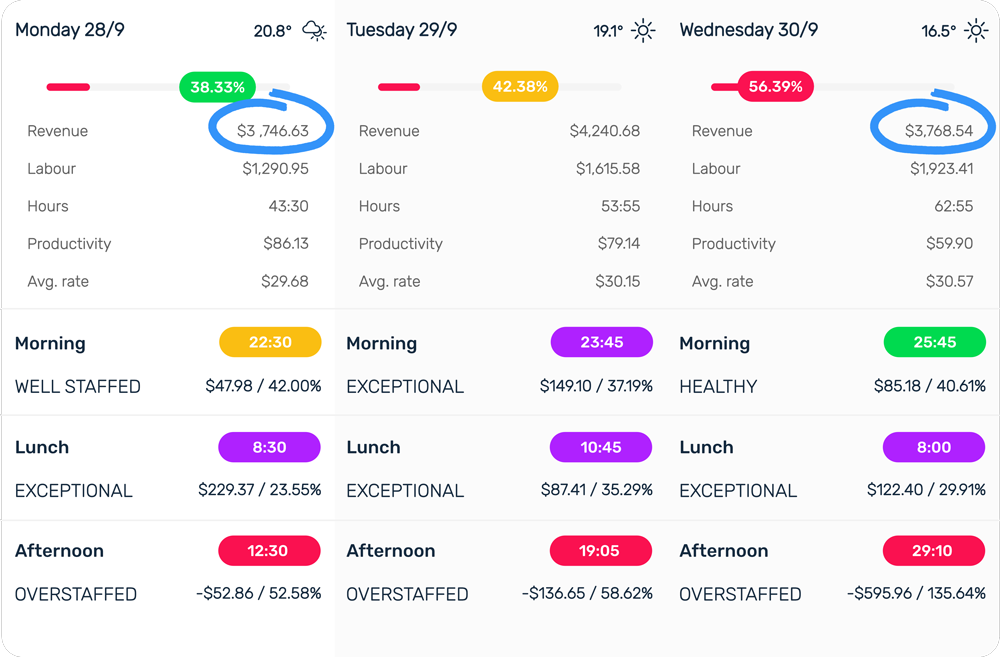
Same roster, different revenue

Look for days with a similar roster but very different revenue forecast.

Why is the roster looking the same with such different revenue?

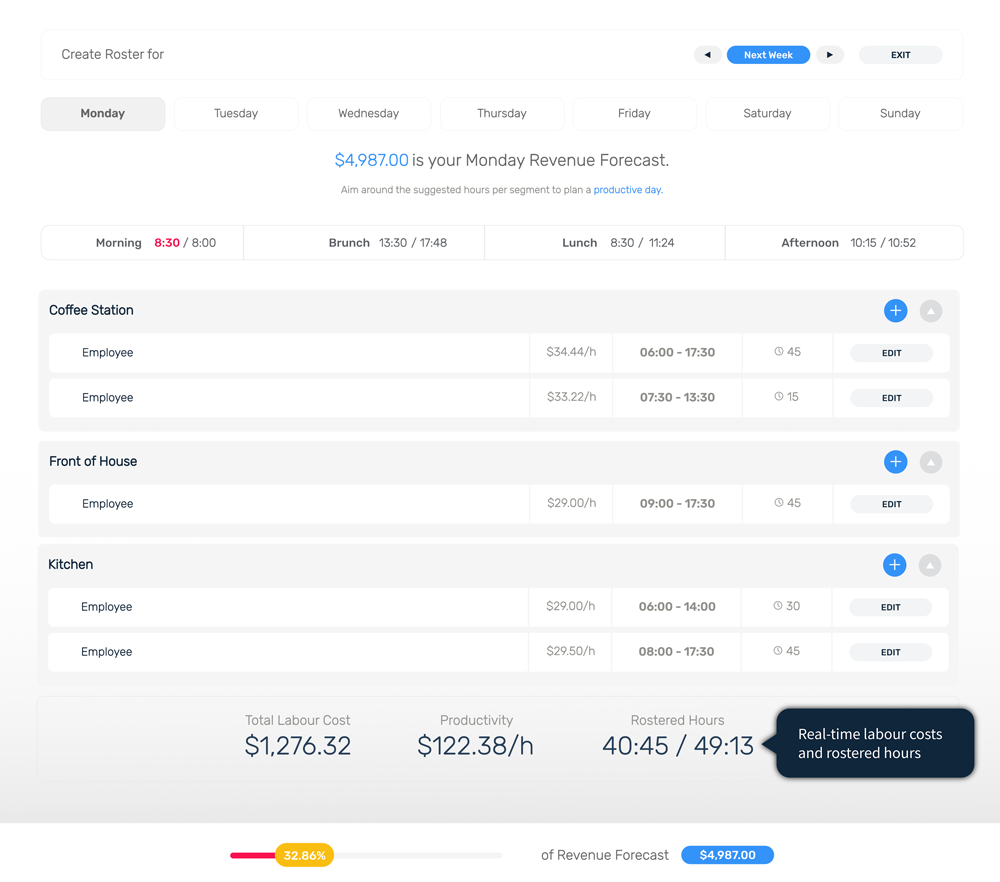
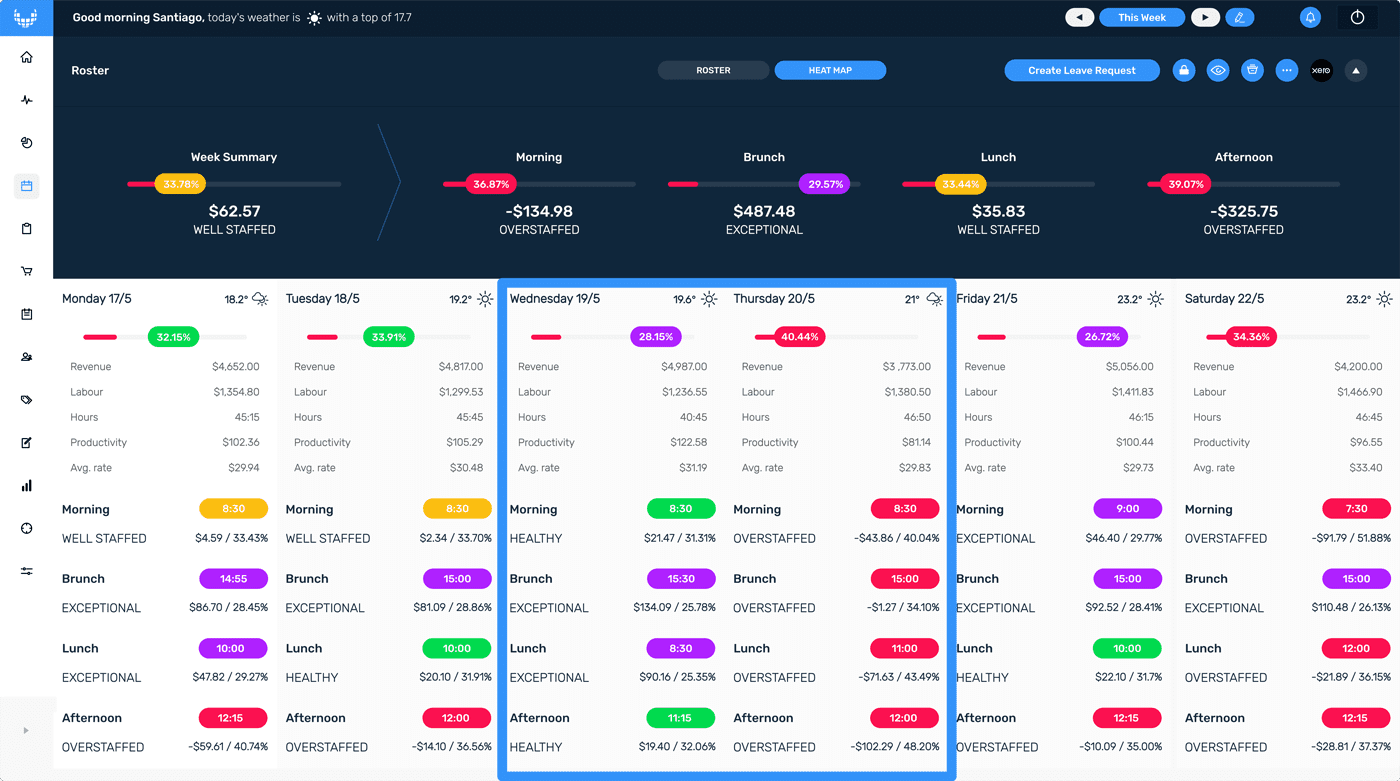
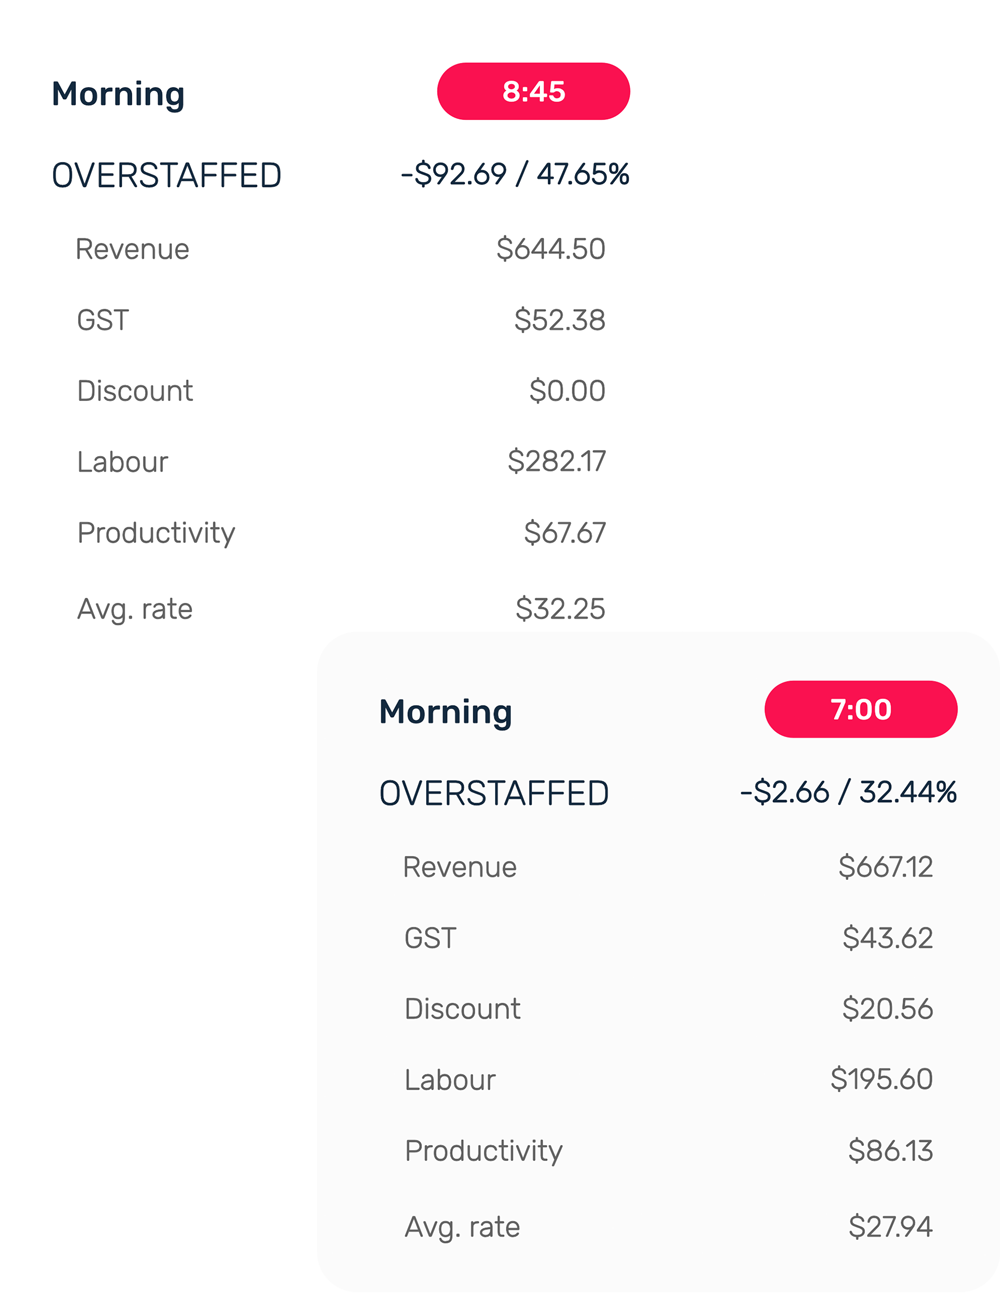
Same day, different segment

Look at the revenue for different segments in the day. If the revenue for the open and close segment of a cafe is usually similar, do they need to be staffed 1:45 hr differently?
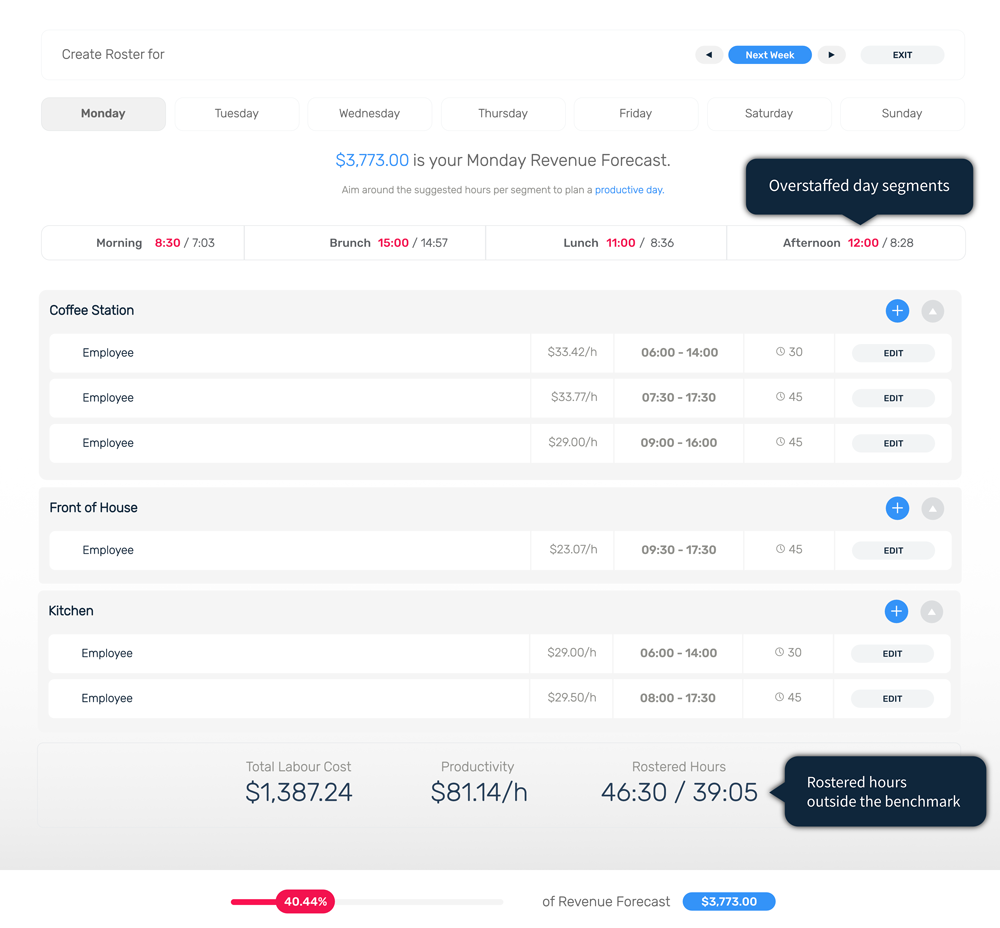
Give and take

The goal is to fall within your benchmark. But we don’t have to win every segment. In this industry, shifts sometimes need more people than the benchmark. We often see this with open and close shifts. Find segments with high productivity that can give a little. You can still roster within your benchmark each day, even with ‘overstaffed’ open and close.

FAQs

Yes, based on your business model you can adjust your roster benchmarks. We recommend a roster budget of 30% - 34% of your weekly revenue for coffee shops and espresso bars. You can edit this benchmark on the 'Settings' page.

Yes, we encourage you to use the 'Heat Map' to track each day segment and to use this feedback to adjust the created shifts, e.g., you can adjust your team's shifts and break times to meet the segment budget.

Didn't find an what you are looking for?

If your question is not in the FAQs list, feel free to reach out for additional support and guidance.